A recent Bloomberg article describes the rapid growth of solar power generation. This graph compares the trend for all renewables to the main fossil fuels used for electricity generation.
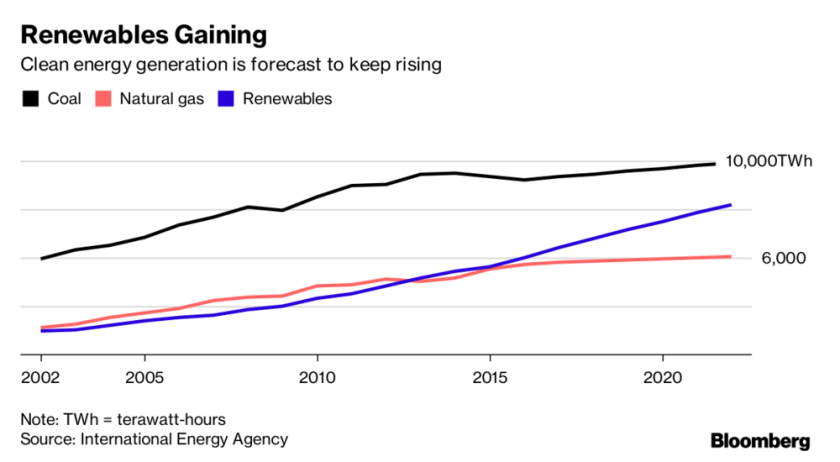
The graph is nice and clean. It includes the main message in the title and subtitle. There are only three curves and the have distinct colors. (But shouldn’t the renewables be green?) The axes tick labels are simple, which is adequate since we are not invited to pay attention yearly details.
The graph would be improved if the forecast parts of the curves were indicated. For example using dashes.
China is installing solar capacity much faster than any other country.

The message is well expressed in the subtitle. And it’s a relief that the graph is not a pie chart. The heights of the columns are much easier to compare than the areas of slices would be. The emphasis is on the first and tallest bar, so it does not need to be a different color for emphasis.
Interestingly the article states that the primary motivation in China is concern in the population about air pollution and environmental degradation, while the main driver in the United States is economic.